
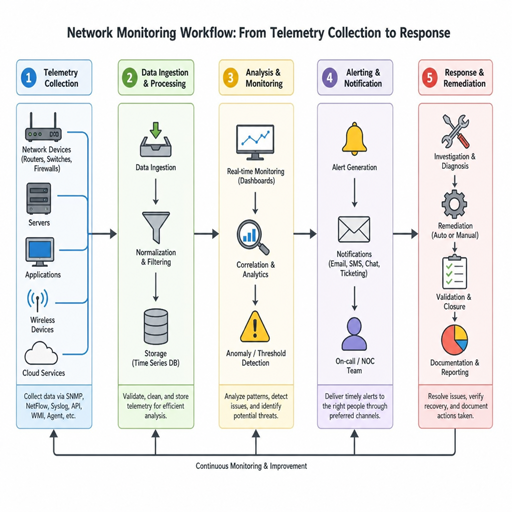
Detecting network anomalies and breaches means finding unusual behavior in network traffic, systems, identities, and devices before that behavior becomes a larger security incident. A strong approach combines continuous network monitoring, disciplined data analysis, practical cybersecurity tools, and clear response procedures. The goal is not to flag every odd event, but to recognize meaningful patterns that may indicate compromise, misuse, misconfiguration, or emerging attack activity.
What does network anomaly detection actually mean?
Network anomaly detection is the process of identifying activity that deviates from expected behavior across a network. That “expected behavior” may include normal traffic volume, common destinations, typical login patterns, approved protocols, device communication habits, and known application behavior. When something falls outside that baseline, security teams investigate whether it is harmless, suspicious, or part of a breach.
An anomaly is not automatically an attack. A software update, a new cloud service, a backup job, or a remote employee working unusual hours can all create unusual traffic. Effective detection depends on context: what device is involved, who owns it, what data it can access, where traffic is going, and whether the activity lines up with legitimate business operations.
This is why anomaly detection belongs inside a wider network security program. It is most useful when paired with asset inventory, logging, threat intelligence, identity controls, endpoint visibility, and incident response. Without that context, even advanced alerts can turn into noise.
Why anomalies matter in breach detection
Attackers often try to blend in. They may use valid credentials, common administrative tools, encrypted channels, cloud platforms, or standard ports to avoid obvious detection. Network anomaly detection helps reveal suspicious behavior that does not match normal usage, even when the individual action looks ordinary in isolation.
For example, a single login from a remote location may not prove anything. But if that login is followed by privilege escalation, access to a sensitive file share, unusual DNS requests, and outbound data transfer to an unfamiliar destination, the combined pattern becomes far more concerning. Data analysis turns scattered signals into a story.
Anomalies also help identify operational weaknesses. A device sending traffic to an outdated service, a forgotten server exposing unnecessary ports, or an application producing abnormal error traffic may not be a breach yet. Still, those findings can reduce risk when they are investigated and corrected early.
Common signs worth investigating
Useful anomaly detection focuses on behavior that can be explained and acted on. Security teams commonly investigate:
- Unexpected traffic spikes from a workstation, server, container, or cloud workload.
- Unusual outbound connections to unfamiliar countries, hosting providers, domains, or IP ranges.
- Abnormal authentication behavior, such as impossible travel, repeated failures, or logins outside normal patterns.
- New lateral movement paths, including device-to-device connections that have not occurred before.
- Suspicious DNS activity, such as high-volume lookups, algorithm-like domains, or requests to newly observed domains.
- Protocol misuse, including administrative protocols used from non-administrative devices.
- Data movement that looks excessive, especially from systems that store sensitive information.
- Unexpected encrypted tunnels, proxy usage, or command-and-control-like beaconing patterns.
Each signal becomes more valuable when enriched with asset type, user role, business function, and historical behavior.
The data that makes detection possible
Network security depends on visibility. You cannot reliably detect what you do not collect, and you cannot prioritize what you do not understand. Good detection starts with high-quality data from the right layers of the environment.
Packet captures can provide deep detail, but they may be expensive to store and difficult to analyze at scale. Flow records, DNS logs, firewall logs, identity logs, endpoint telemetry, cloud logs, proxy logs, and application logs often provide enough context for day-to-day anomaly detection. The best mix depends on the organization’s architecture and risk profile.
Core data sources
A practical network monitoring program usually draws from several categories:
- Network flow data Flow records show who communicated with whom, when, for how long, and with how much traffic. They are useful for spotting traffic spikes, unusual destinations, lateral movement, and data transfer patterns.
- DNS and domain activity DNS logs can reveal malware callbacks, suspicious tunneling, typo-style domains, or unusual domain-generation behavior. They also help analysts connect activity to human-readable destinations instead of only IP addresses.
- Firewall, proxy, and gateway logs These sources show allowed and blocked traffic, web destinations, policy violations, and attempts to reach restricted services. They are especially valuable when mapped to users and devices.
- Identity and authentication logs Many breaches begin with compromised credentials. Authentication data helps detect abnormal login locations, unusual access times, repeated failures, privilege changes, and new service account behavior.
- Endpoint and server telemetry Endpoint visibility links network activity to processes, users, files, and commands. This context can separate a legitimate administrative action from suspicious remote execution.
- Cloud and SaaS logs Modern networks extend into cloud infrastructure and software platforms. Cloud control-plane events, storage access logs, API calls, and SaaS audit logs are essential for detecting unusual access outside the traditional perimeter.
Data quality matters more than volume
Collecting more data does not automatically improve detection. Poorly labeled, incomplete, duplicated, or unstructured logs can overwhelm analysts and produce misleading results. Useful data analysis requires consistent timestamps, normalized fields, reliable asset identifiers, and clear ownership.
A smaller set of trusted logs is often better than a large pile of unreliable events. Start with sources that answer important security questions: which user, which device, which destination, which action, which time, and whether the behavior is normal for that entity. Then expand coverage where blind spots create meaningful risk.
Baselines turn raw activity into context
A baseline is a picture of normal behavior. It may describe traffic volume, login patterns, device relationships, application dependencies, protocol usage, or data transfer behavior over time. Without baselines, every alert is judged in isolation, which makes false positives more likely.
Baselines should be specific enough to be useful. “High outbound traffic” is vague. “This database server rarely sends outbound traffic to the internet, but today it transferred a large volume to an unfamiliar external host” is actionable. The more precise the baseline, the easier it becomes to identify behavior that deserves attention.
What to baseline first
Teams do not need to baseline everything at once. Start with high-value and high-risk areas:
- Critical servers and databases.
- Domain controllers and identity providers.
- Administrative workstations and privileged accounts.
- Internet-facing services.
- Cloud workloads that store or process sensitive data.
- Remote access systems and VPNs.
- Business-critical SaaS platforms.
These assets give attackers leverage, so deviations around them matter more. Once coverage improves, baselines can expand to standard user devices, branch networks, development environments, and partner integrations.
Baselines must evolve
Normal behavior changes. New applications launch, employees move roles, offices open or close, infrastructure migrates, and cloud services shift. A baseline that never updates becomes stale and noisy. A baseline that changes too quickly may learn malicious behavior as normal.
A balanced approach uses review cycles, change-management input, and analyst feedback. When a known business change explains a deviation, the model or rule can be tuned. When no explanation exists, the anomaly should remain visible until investigated.
How do teams separate harmless anomalies from real threats?
Teams separate harmless anomalies from real threats by correlating multiple signals, enriching alerts with context, and applying a repeatable triage process. A single unusual event may be low priority, but a chain of unusual events involving sensitive assets, privileged accounts, or known attack techniques deserves faster escalation. The question is not simply “Is this different?” but “Is this different in a way that creates security risk?”
Good triage starts with the asset. An unusual outbound connection from a test machine may matter less than the same behavior from a payroll server, domain controller, source code repository, or executive laptop. User context matters too: a system administrator connecting to many hosts may be normal during maintenance, while the same pattern from a marketing laptop may suggest lateral movement.
A practical triage checklist
Use a consistent checklist to reduce guesswork:
- Identify the entity: Which user, device, application, workload, or account is involved?
- Confirm ownership: Who is responsible for the asset, and what is its business purpose?
- Check sensitivity: Does the entity access confidential data, credentials, production systems, or customer information?
- Review timing: Did the activity occur during normal business operations, maintenance, travel, or a known deployment?
- Correlate signals: Are there related authentication failures, endpoint alerts, DNS requests, privilege changes, or data transfers?
- Compare history: Has this entity behaved this way before, or is the pattern new?
- Assess destination: Is the external host known, trusted, newly observed, or suspicious?
- Look for sequence: Does the timeline resemble reconnaissance, credential abuse, persistence, lateral movement, or exfiltration?
- Decide action: Should the team monitor, tune, investigate, isolate, block, or escalate?
This structure helps analysts avoid both extremes: ignoring unusual behavior because it is inconvenient, or treating every deviation as a crisis.
Detection methods and where they fit
No single method catches every breach. Strong programs layer several types of detection so that weaknesses in one method are covered by strengths in another. The right balance depends on available telemetry, team maturity, business risk, and the complexity of the environment.
Rule-based detection
Rule-based detection uses defined logic to identify suspicious activity. Examples include repeated failed logins, connections to blocked countries, use of prohibited protocols, or traffic from a server that should not access the internet. Rules are transparent and easy to explain, which makes them useful for compliance, repeatable investigations, and known patterns.
The limitation is that rules only catch what they are designed to catch. Attackers can change infrastructure, timing, volume, or techniques to avoid obvious thresholds. Rules also require maintenance when systems, applications, or business processes change.
Statistical anomaly detection
Statistical methods compare current behavior against historical norms. They may flag traffic that exceeds normal ranges, rare communication pairs, unusual session durations, or abnormal login frequency. These approaches are useful when the suspicious behavior is not tied to a known signature.
The challenge is tuning. Too sensitive, and the system floods analysts with harmless deviations. Too loose, and subtle attacks are missed. Statistical detection works best when baselines are specific to assets, users, peer groups, and business functions.
Machine learning techniques
Machine learning can help identify patterns across large and complex datasets. In network anomaly detection, it may be used to group similar behavior, detect outliers, classify suspicious activity, or prioritize alerts based on multiple features. It can be especially useful when activity is too varied for simple rules.
Machine learning is not magic. It depends on good data, thoughtful feature engineering, validation, and ongoing monitoring. Models can drift as environments change, and they may produce results that require analyst interpretation. The most effective use of machine learning is usually practical and narrow: reducing noise, surfacing unusual relationships, or ranking events for investigation.
Signature and threat-intelligence matching
Signature-based tools detect known malicious indicators, such as confirmed bad IPs, domains, file hashes, or exploit patterns. Threat intelligence can add useful context to outbound connections, phishing infrastructure, malware command-and-control behavior, and known attacker techniques.
These methods are valuable, but they are reactive by nature. Indicators can expire, change, or be shared by legitimate services. They should enrich anomaly detection rather than replace behavioral analysis.
Cybersecurity tools that support network monitoring
Cybersecurity tools work best when each one has a clear role. Buying more platforms does not guarantee better detection; integration and process matter just as much. The goal is to create a workflow where telemetry is collected, enriched, analyzed, prioritized, investigated, and acted on.
Common tool categories
|
Tool category |
What it helps detect |
Practical value |
|---|---|---|
|
SIEM |
Correlated log events across systems |
Centralizes data analysis and investigation timelines |
|
NDR |
Suspicious network behavior and traffic patterns |
Improves visibility into east-west and outbound traffic |
|
IDS/IPS |
Known exploit patterns and policy violations |
Provides signature-based detection and blocking options |
|
EDR/XDR |
Endpoint activity tied to network behavior |
Connects suspicious traffic to processes, users, and files |
|
Firewall and proxy platforms |
Allowed, blocked, and web traffic |
Enforces policy and logs internet-facing behavior |
|
SOAR |
Repeatable response actions |
Helps standardize triage, enrichment, and containment |
|
Cloud security tools |
Cloud workload, API, and control-plane activity |
Extends detection into cloud environments |
A mature environment may use several of these tools together. A smaller team may begin with firewall logs, endpoint telemetry, identity logs, and a well-managed SIEM or managed service. The important point is not tool count, but whether the team can answer security questions quickly and reliably.
Building a practical anomaly detection workflow
A workflow turns alerts into decisions. Without a defined process, alerts pile up, investigations vary by analyst, and important lessons never feed back into detection logic. A practical workflow should be simple enough to follow during pressure and flexible enough to adapt as threats change.
Step 1: Define what matters
Start with business impact. Identify systems, data, accounts, and operations that would cause meaningful harm if compromised. This may include customer data, financial systems, intellectual property, production infrastructure, executive accounts, backup systems, and identity platforms.
Detection priorities should reflect that impact. An anomaly involving a critical server should not be treated the same as routine noise from a low-value lab device. Risk-based prioritization helps teams use limited time wisely.
Step 2: Map normal communication
Document which systems should communicate and why. For example, a web server may connect to an application server, which then connects to a database. If that database begins communicating with user laptops or unfamiliar external hosts, the change is worth investigating.
This mapping also supports segmentation and access control. Detection improves when the environment has clear expectations. If every device can talk to every other device, anomalies become harder to interpret.
Step 3: Create layered detections
Use several detection types around the same risk. For credential compromise, combine abnormal login detection, impossible travel logic, privilege-change monitoring, new device access, and unusual data downloads. For potential exfiltration, combine outbound volume analysis, unusual destination detection, sensitive asset monitoring, and endpoint process context.
Layering increases confidence. One alert may be ambiguous. Three related alerts across identity, endpoint, and network telemetry often provide a much clearer signal.
Step 4: Enrich and prioritize alerts
Enrichment adds context automatically where possible. Asset criticality, user department, device owner, known vulnerabilities, geolocation, domain reputation, and previous behavior can all help rank an alert. Prioritization should make the riskiest activity visible first.
Avoid relying only on severity labels from tools. A “medium” alert on a sensitive identity system may deserve immediate attention. A “high” alert on a retired test machine may be less urgent after validation.
Step 5: Investigate with a timeline
Build a timeline that shows what happened before, during, and after the anomaly. Include logins, process execution, network connections, DNS queries, file access, privilege changes, and security control actions. Timelines reveal sequence, and sequence is often what separates benign activity from breach behavior.
Analysts should record the evidence behind each conclusion. This improves handoffs, supports incident review, and helps refine detections later.
Step 6: Feed lessons back into controls
Every investigation should improve the environment. If the alert was useful, turn the logic into a stronger detection or playbook. If it was noisy, tune the threshold, add context, or suppress only the clearly benign condition. If the anomaly exposed an unnecessary pathway, fix the architecture or policy.
This feedback loop is where detection programs mature. Tools generate signals, but process turns those signals into better security.
Breach patterns that anomaly detection can reveal
Many breach behaviors create network or identity anomalies before they become obvious incidents. Recognizing these patterns helps teams investigate with purpose instead of chasing disconnected events.
Reconnaissance
Attackers often explore the environment after gaining initial access. They may scan internal hosts, query directories, enumerate shares, or test access to systems. This can appear as unusual connection attempts, new device relationships, or abnormal use of administrative protocols.
Lateral movement
Lateral movement occurs when an attacker shifts from one system to another. Network monitoring may reveal a workstation connecting to servers it has never accessed, use of remote services from unexpected devices, or authentication chains across multiple systems. Endpoint data can confirm whether legitimate tools are being misused.
Command and control
Compromised systems may communicate with attacker-controlled infrastructure. Signs can include periodic beaconing, unusual DNS requests, encrypted traffic to unfamiliar destinations, or outbound connections that do not match the device’s role. These patterns may be subtle, so history and peer comparison are important.
Data staging and exfiltration
Before data leaves the network, it may be collected, compressed, copied, or moved to staging locations. Network anomaly detection can reveal unusual internal transfers, large outbound sessions, uploads to unapproved platforms, or access to sensitive repositories by accounts that do not normally use them.
Reducing false positives without missing threats
False positives are not just annoying; they weaken security by draining attention. Analysts who see too many low-quality alerts may miss the one that matters. Reducing noise is therefore a core part of detection engineering, not an administrative afterthought.
Start by separating predictable business activity from unexplained activity. Scheduled backups, vulnerability scans, patch deployments, data sync jobs, and monitoring checks should be documented and tagged. Once known-good behavior is accounted for, truly unusual patterns stand out more clearly.
Ways to improve alert quality
- Use peer groups: Compare a database server to other database servers, not to laptops.
- Add asset criticality: Raise priority when sensitive systems or privileged accounts are involved.
- Require multiple conditions: Combine volume, destination rarity, time, and asset role instead of relying on one threshold.
- Tune by environment: A university network, manufacturer, law firm, and SaaS company will not share the same normal patterns.
- Review closed alerts: Identify which detections produced useful findings and which wasted time.
- Document exceptions: Suppress known benign activity narrowly, with owners and expiration dates where appropriate.
The best tuning keeps suspicious behavior visible while reducing alerts that have no realistic security value.
Metrics that show whether detection is improving
Detection programs need measurement, but the metrics should encourage better outcomes rather than higher alert volume. A dashboard full of alerts does not prove strong security. It may prove the opposite: too much noise and too little prioritization.
Useful metrics include the percentage of alerts closed as benign, time from alert to triage, time from triage to containment, number of detections mapped to critical assets, coverage of key log sources, and recurring blind spots discovered during investigations. Teams can also track how often detections are tuned based on incident reviews or tabletop exercises.
Qualitative review matters too. Analysts should be able to explain why an alert fired, what evidence supported the decision, and what action followed. If nobody can explain the detection, it is hard to trust or improve.
Governance, privacy, and responsible monitoring
Network monitoring must be handled responsibly. Security teams often process information related to users, devices, locations, access patterns, and business activity. Organizations should define what is collected, why it is collected, who can access it, how long it is retained, and how it is protected.
Good governance also improves detection quality. Clear ownership, retention rules, access controls, and audit trails reduce confusion during investigations. Monitoring should support legitimate security goals, not become an uncontrolled data collection exercise.
Security teams should work with legal, privacy, compliance, human resources, and business leaders where appropriate. The exact requirements depend on the organization, industry, and jurisdictions involved, so policies should be reviewed by qualified internal stakeholders.
Common mistakes to avoid
Many anomaly detection programs struggle for predictable reasons. They collect data without a plan, deploy tools without defined use cases, or treat machine learning as a replacement for security fundamentals. Avoiding these mistakes can save time and improve results.
- Starting with tools instead of questions: Define what you need to detect before choosing technology.
- Ignoring asset inventory: Unknown devices create unknown risk and make anomalies harder to evaluate.
- Overlooking identity data: Credential abuse is central to many breaches, so authentication context is essential.
- Using static thresholds everywhere: Fixed limits may miss subtle attacks or create constant noise.
- Failing to tune detections: Environments change, and detections must change with them.
- Treating alerts as isolated events: Correlation across identity, endpoint, cloud, and network data is often where the real story appears.
- Neglecting response planning: Detection only helps if the team knows what to do next.
A practical starting roadmap
Organizations do not need a perfect security operations program to begin improving anomaly detection. A realistic roadmap focuses on visibility, context, and repeatable action.
First, identify critical assets and confirm that the most important logs are available. Next, establish baselines for high-risk systems and privileged accounts. Then build a small set of high-value detections around behaviors such as unusual outbound traffic, abnormal logins, lateral movement, and suspicious DNS activity.
After that, define triage steps and escalation paths. Review each investigation, tune noisy logic, and document what worked. As confidence grows, expand coverage to cloud platforms, SaaS tools, remote work patterns, and additional business systems.
The strongest programs improve steadily. They do not depend on one alert, one tool, or one model. They combine data analysis, network monitoring, cybersecurity tools, machine learning where it adds value, and human judgment that understands the organization’s real risks.
